Overtaking Trends: The case for 2000bhp F1 cars
MARCH 17, 2022
Written by Rowland Jowett
It would be convenient to make sweeping generalisations when it comes to car performance, for example, perhaps the short braking zones of F1 cars make them difficult to pass. Could it be this straightforward, and can simulation show us the way to making more exciting cars?
Part 1 of this series examined the effect that fundamental car parameters have on overtaking performance. This second article aims to answer why, and what direction can be pursued to make the recipe for a perfect F1 car. To recap the findings from before:
Heavier cars are better at overtaking [other heavy cars].
A significant drop in power improves things, but conversely an increase in power doesn’t seem to make overtaking any worse.
A drop in downforce helps substantially
High grip seems to be the enemy of overtaking performance.
Our laptime simulation, Dynamic Lap, has a special feature (called Secondary Lap Sensitivities) that can be used to drill down into the data and understand how or why the car will be faster when changing setup. This finds the origin of the lap time improvements. Overtaking Lap currently has no such feature, but looking at correlations with various lap metrics, some conclusions can be drawn.
Correlation Metrics
TLDR: Feel free to skip these six graphs and go to “The Winning Formula” section if your coffee hasn’t kicked in yet.
The data from part 1 is plotted onto these graphs, so that at each mass, power, downforce and grip level it is possible to see how much excess grip is required to complete the overtake. A positive value indicates that the following car would need extra grip or pace to overtake the lead car, 0% means it could pass just by following in the wake, while negative shows that the attacking car could get past even if it were slower.
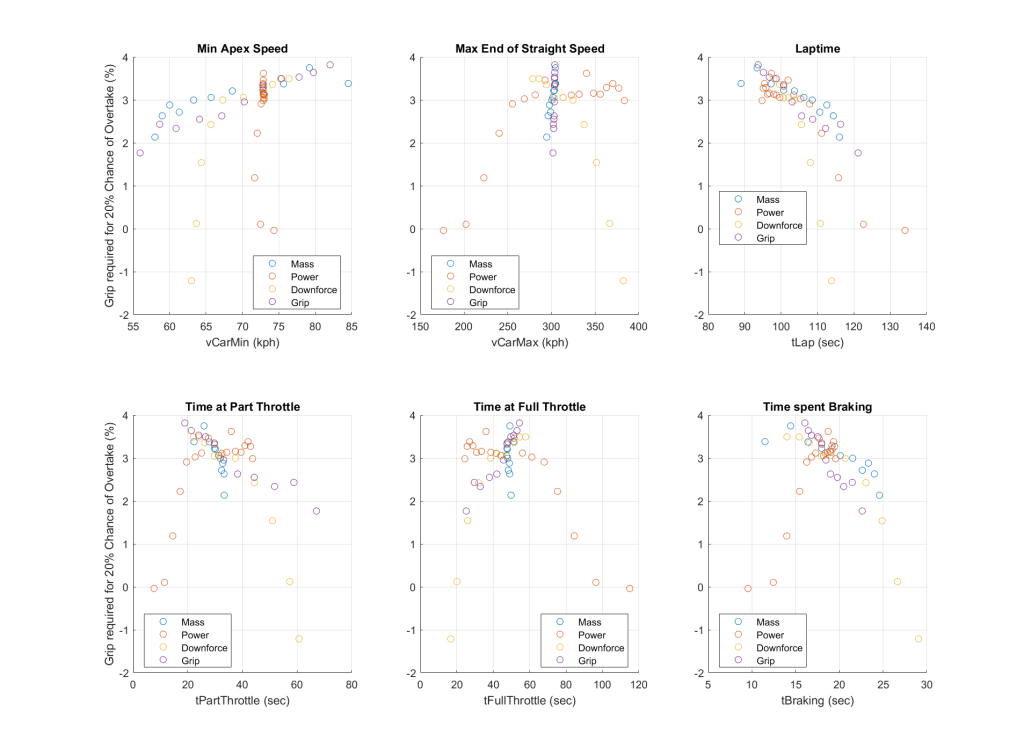
Correlation of overtaking with car performance metrics.
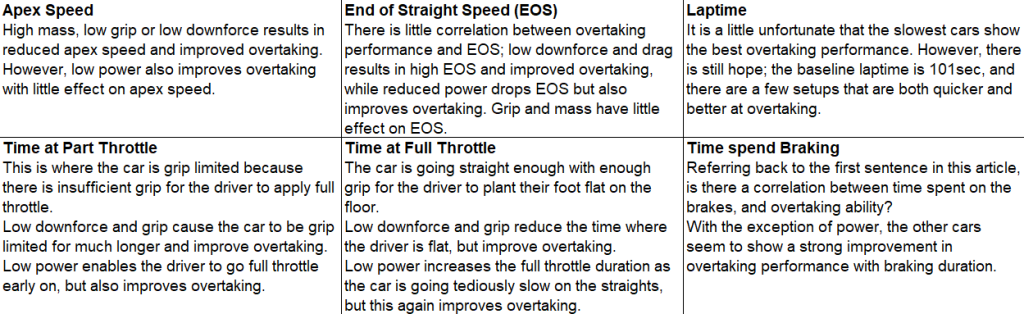
There is quite a bit to digest here, but to break down the trends:
The time spent on braking seems to show a reasonable correlation if we exclude power from this graph:
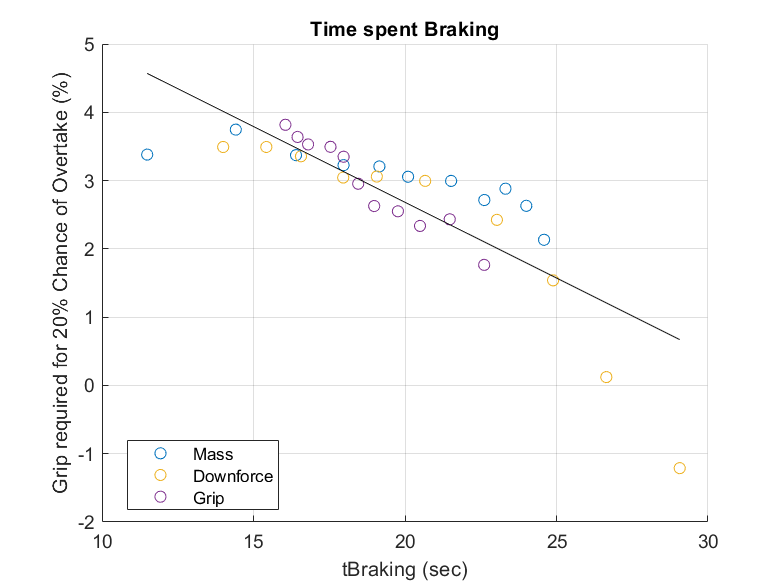
Is there a correlation between braking performance and overtaking?
The phrase “correlation is not causation” gets justifiably bandied around, and short of further evidence, that might be a fair appraisal. However, plenty of overtakes originate from the braking zone, so it seems reasonable to conclude that extending this might have a beneficial effect. Mass, downforce and grip all influence the tyres ability to haul the car up, whereas power does not, so maybe it is legitimate to group these three together.
A more rigorous study is required, looking into the effect of a greater range of car parameters, and decoupling downforce from the drag effect (here “downforce” is accompanied by a drag increase as is usually the case in reality). Drilling down into the origins of the overtake might also help to shed some light on the problem; was it initiated during braking, mid-corner, exit or the straight.
Fortunately, with simulation it is not always necessary to understand exactly why something happened, but the trends can guide you in the right direction without perfect knowledge. As my previous boss explained, the reason for building complex models is because it is difficult to fathom it out in your head.
The Winning Formula
The objective is to make the perfect recipe for overtaking, while preserving the heart of F1. Formula E, touring cars and Moto GP all deliver an abundance of thrills, but what makes Formula 1 cars stand out is that they are the quickest around a track and employ leading-edge engineering. Referring back to Overtaking Fundamentals: Action packed 2022 F1 season?, there were some promising directions that to explore:
Current cars are operating on the flat part of the power sensitivity curve; in theory doubling power to 2000bhp seems to have little impact on overtaking performance. This doesn’t sound unreasonable in an age where an exotic electric family car can reach F1 power levels.
All that power is likely to require a more intricate engine, and the extra speed will require beefier crash protection, both would add weight. The mass is increased to 1000kg, and as previously demonstrated, this might be no bad thing.
A reduction in downforce to 50% improves the chance of an overtake from 20% to 80%.
Overtaking Performance
What does this 2000bhp, 1000kg, 50% downforce “F1” beast look like?
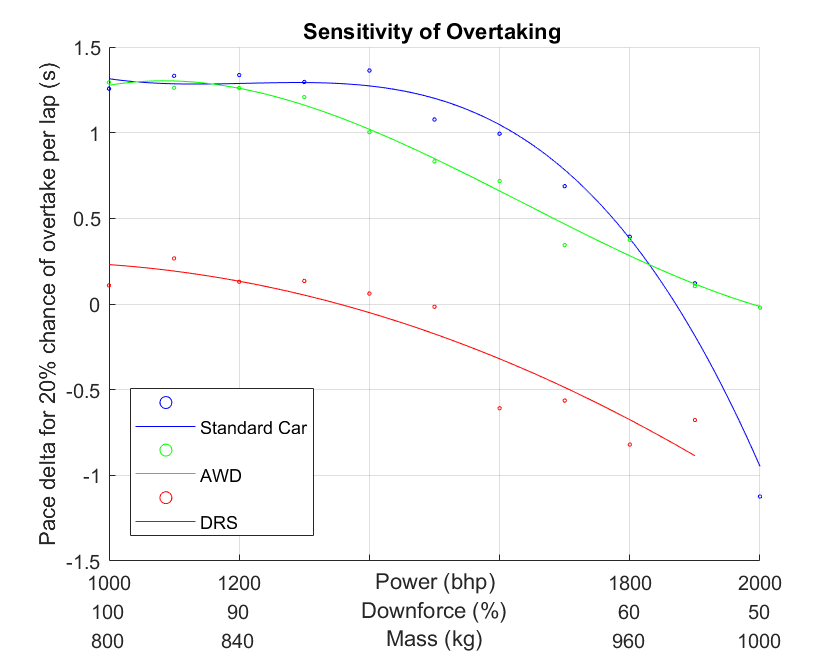

Overtaking performance as power and mass are increased and downforce is reduced.
The blue lines above represent the standard car, and on the LHS of these graphs is the baseline car configuration with 1000bhp|100% DF|800kg. The LH graph shows that a 1.3sec pace advantage is required for the baseline to have a 20% chance of overtaking. For the RH graph, the overtaking cars are given a constant grip advantage which enables a 20% chance of overtake per lap for the baseline setup.
Increasing the power and mass, while reducing the downforce to 1400bhp|80% DF|880kg has very little impact on the pace delta required for an overtake (still 1.3sec), but the probability of an overtake increases from 20% to 43%. Why does the probability of an overtake increase so dramatically, while the required pace delta remains the same? The answer is that despite the extra power, the mass increase and downforce reduction cause the car to be slower, which makes it easier to make up the 1.3sec pace deficit than it would be with a quicker car.
At the extreme RHS of the graph, the car has the full 2000bhp|50% DF|1000kg, and the overtaking performance really start to take off. The following car can pass even if it is up to 0.9sec slower than the lead car, and the probability of an overtake with a grip advantage is 90% per lap. Sounds fantastic, but there is a catch…
Fixing the Traction Issue and Preserving the Pace
The standard car sets a laptime of 101sec in baseline configuration, however at 2000bhp|50% DF|1000kg the laptime plummets by 9sec to 110sec. The extreme power is not enough to offset the loss in downforce. The driver cannot put all that power down, and the concepts falls short of our objective of maintaining the pace.
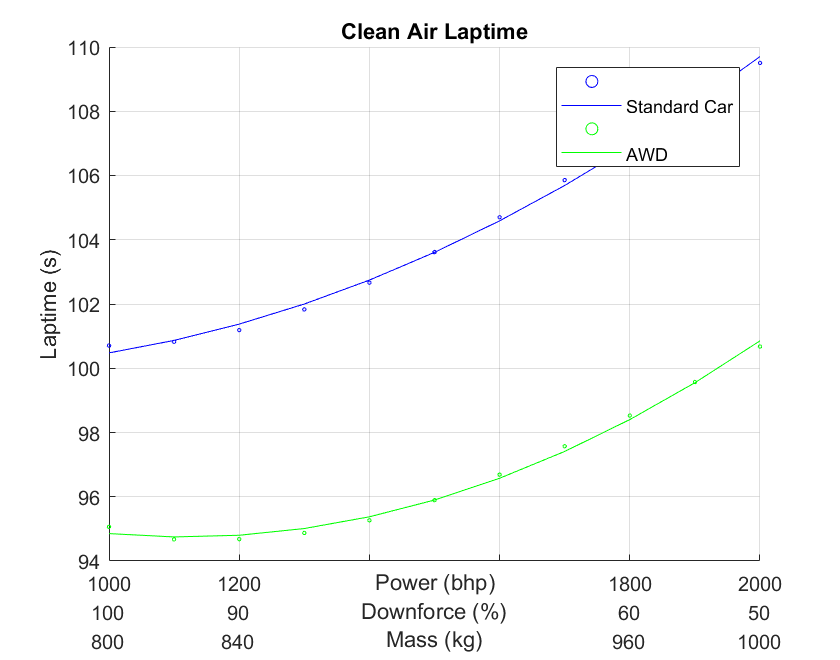
Unimpeded car pace as power and mass are increased and downforce is reduced.
A possibility for improving the traction would be to deploy AWD (all-wheel drive) as shown by the green line above. The car can exploit the power more effectively, and at 2000bhp|50% DF|1000kg a laptime of 101sec can be maintained, meeting our objective of setting a similar overall pace to the baseline.
Going back to the previous graphs of overtaking performance, but this time examining the green AWD line on the RH graph, it intriguing to note that at 1000bhp|100% DF|800kg, the AWD car cannot perform an overtake. With a 95sec laptime, it’s hard to find the 1.3sec pace advantage required for an overtake, even with the grip advantage of fresh tyres. This changes as the wick is turned up; the relative overtaking performance of the AWD car improves and beyond 1800bhp|60% DF|960kg it surpasses the RWD car. At 2000bhp|50% DF|1000kg with AWD the ideal formula is achieved; a car setting laptimes worthy of the pinnacle of motorsport, but with sensational overtaking ability.
How does this compare to DRS?
To put things in perspective, the red line shows the powerful effect that DRS has on the standard car. In baseline trim, DRS narrows the pace delta required for an overtake from 1.3sec to just 0.2sec, and at the grip level where the baseline car has a 20% chance of an overtake per lap, this is boosted to 88% when DRS is applied.
On the other hand, the 2000bhp|50% DF|1000kg AWD car can attempt an overtake even with the same pace as the lead car. If it has a grip advantage then the chance of an overtake rises to 91% per lap. This presents organic overtaking opportunities that surpass those provided by DRS. This powerful AWD car seems like a promising candidate to provide an abundance of heroic wheel to wheel action without any gimmicks.
What does a 2000bhp car look like?
Back in the turbo era of 1986 BMW designed a masterpiece of an engine that delivered close to 1350bhp in qualifying trim. Allegedly they were so powerful that drivers have reported having wheelspin at 345kph while racing in 6th gear. Perhaps 2000bhp is a little ludicrous, but this is 2022, and with the added traction of AWD, maybe this is feasible.
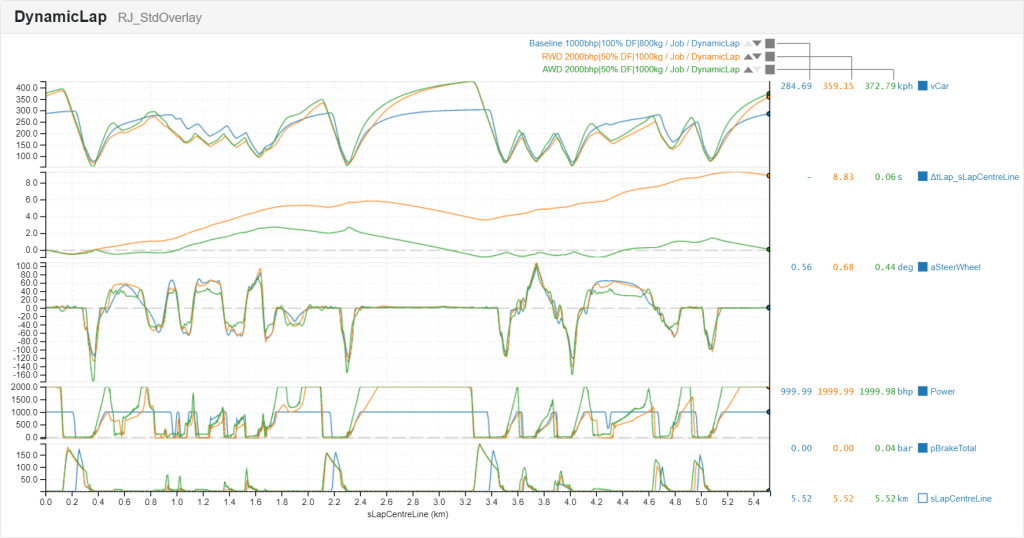
Comparison of Baseline, 2000bhp RWD and 2000bhp AWD.
From the standard overlay above, the difference in end of straight speed (EOS) is immense. The drop in downforce and drag, and doubling of power increases top speed from 303kph to 427kph (188mph to 265mph). This sounds like a safety nightmare, but perhaps it is not too bad, because despite the colossal EOS speed advantage, the car must go slower through the esses and high-speed corners due to the drop in downforce, so it is only at the end of these long straights where speed is higher [caveat: I have spent 0% of my career looking at circuit safety]. The AWD car clearly has a massive advantage when it comes to straight line acceleration, and this is where the majority of the laptime deficit is reclaimed, bringing the laptime inline with the baseline car.
What about the Tyres and Wake?
From part 1 of this series the two highest overtaking sensitivities were wake and grip, so it makes good sense to address these. It is highly likely that a doubling in power and halving of downforce would cause:
The tyres to be destroyed very quickly.
A reduction in aerodynamic wake.
This would result in a larger pace differential between competing cars, and improve the car following performance, perhaps making the overtaking spectacle even more dramatic than the numbers above suggest. Maybe when these two effects are considered, perhaps such extreme changes to power and downforce would not be required to achieve all of the desired effect.
While it seems reasonable that these secondary effects might further enhance the overtaking performance, it is worth mentioning that a racing team running a 2000bhp car with a top speed of 265mph would be very eager to add downforce (which comes with a drag penalty) in order to trade EOS for apex speed. The isochronal ratio for this car would be very low, meaning that teams would add very dirty downforce to the car (downforce at the expense of plenty of inefficient drag). Such drag increases would intensify the wake, thus ruining the party. The governing body would have to keep the teams in check by devising a new set of aero regulations to massively restrict downforce.
Conclusion
Is F1 trapped in a local minima, struggling to climb out?

Thanks to Overtaking Lap, the enemies are clear: high downforce, wake effect and grip. There also seems to be some correlation between changes which impact the braking potential of the car, and overtaking performance. With some tinkering it is possible to produce a highly dramatic car which maintains the spirit of being the fastest around a race track.
A 50% reduction in downforce, through a regulation change, would massively improve the overtaking potential. This makes the car rather slow around the corners but the laptime can be clawed back with a heavier, monstrous 2000bhp AWD powertrain. The combined effect of these changes produces a formula with more inherent overtaking potential than DRS. When considering the wake reduction and tyre wear effect on top of this, the estimated improvement may be conservative and it might be even more dramatic.
Any car or circuit parameters can be adjusted in Overtaking Lap, so there are ample opportunities to investigate on track action. An exciting possibility would be in the domain of circuit design. If Hermann Tilke wants to get in touch, we would welcome the chance to help formulate the best circuit layout ever conceived.