The Heart of F1
JANUARY 11, 2022
Written by Alex McCormick
Racing or Playing Ping Pong?
In this series of articles, we’re exploring what it is that sets one racing series apart from the others. Every racing series, formula, or championship has its own unique set of challenges – some of which change on a regular basis, and some of which have barely been touched since the inception of the sport. This week, we’re looking at Formula 1.
At the heart of Formula 1 is the principle that cars should be open-wheel, open-cockpit, single-seat racing cars which highlight the skills of the driver by leaving as much up to their control as it’s feasible to do.
Based on recent events, you’d be forgiven for thinking that F1 is just a show, a race for entertainment, or a travelling circus showing off glamorous cities around the world. But rest assured, just occasionally a serious sporting event breaks out.
The Role of Simulation
In principle, setting up a fast, open-wheel, single-seat racing car isn’t rocket science. You bolt on a rear wing that gives you the right lift/drag ratio, pin the front of the car as low as it’ll go, use any degrees of freedom you have left to shape the aerodynamic balance through a corner, and then tweak the front flap to put the balance in a place that stops the tyres from exploding. Simple. But turning principles into practice is often much more complicated, and can take full seasons and thousands of laps to get it right. It’s much faster and cheaper to do those laps in software.
Next year, there are six “sprint” events, where teams have only one hour to put the car in the right window for the race. In this article, we’ll explore how simulation can return much more effective results than any work on a real car could possibly hope to achieve in the same time frame.
Another core principle of F1 is that the cars should be designed and build by constructors, with each team attempting to solve the “formula” as effectively as they can. This means that before pencil is even put to paper, some virtual representation of the car has done thousands of virtual laps, producing very real results which feed in to the design from day zero.
Budget restrictions are now heavily limiting the number of updates that can be made to a car, and wind tunnel time restrictions are making every single second that the wind is on critical. Ensuring that the development of the car is pointing in the right direction before it even hits the track for testing is vital. Once again, computer simulations provide the answers.
Finally, in F1 there are additional complications – and this is what makes it truly unique. The tyres require constant management, so much so that the cars are often 3-4 seconds slower than ultimate pace, so any clever engineering that reduces the management required is a massive bonus. There are also other cars on track, which makes race strategy important, and means the problem is not always as simple as designing for minimum lap time…
A Short View Back to the Past
While Oliver was being quizzed on the minimum radius of curvature of a tangent continuous curve on the external surface of a vertical cross section of bodywork parallel to the C-C plane, I was doing my GCSEs. After uni, I spent a few years with the now-eight-time Constructors World Champions at Mercedes F1 team, and then joined Canopy to continue to push the cutting edge of motorsports simulations.
Here, I hope to show a small snapshot of some of the more interesting setup questions a team might encounter on their way to the F1 circus.
At Canopy we can’t promise immunity from stewarding decisions, we can’t stop the tyres from exploding without warning (*though we can make this less likely), and we definitely can’t tell you the minimum radius of curvature of tangent continuous curve on the external surface of a vertical cross section of bodywork parallel to the C-C plane… but we can give you the tools to make a fast car even faster.
Part 1: Bolt on a Rear Wing
Modern F1 is frequently said to be “all about aerodynamics”. As someone who has worked on suspension systems for five years, this is completely true. Almost everything in the car design and setup is about getting the aerodynamic platform in the right conditions at the right time. As such, F1 teams frequently turn up to race weekends with two or three different rear wings, but they usually have a pretty good idea of what they want to run before they arrive.
Here, I have compared the performance of two different aero packages simulated in the Canopy platform. The dark line is a “high downforce” package, which carries more speed through the corners, but reaches a lower top speed than the “low downforce” package. It takes just two simulations – and less time than doing a run on-track – to work out which one is quicker.
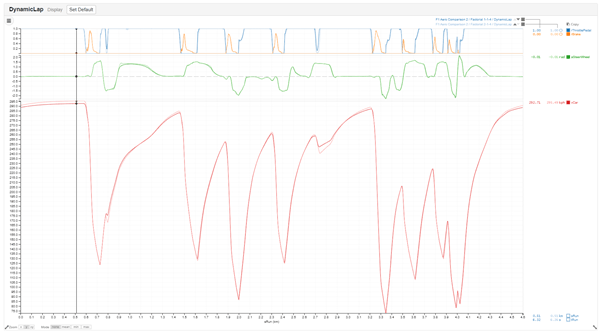
Barcelona Speed Trace Comparison. Showing throttle, brake, steer, and vCar channels for a high downforce car (dark colours) and a low downforce car (light colours). Note the difference in end-of-straight speed at the cursor, and mid-corner speed in turn 9.
As we mentioned before, the principles rarely turn quite so simply into practice. In practice, different rear wings interact differently with the diffuser, and therefore perform slightly differently as the ride height changes. To make this a fair comparison, we need to compare the wings at their optimal rear ride height. But then the rear ride height affects the car balance, so we need to adjust the front flap angle… which then affects the plank wearing against the ground, which affects the front stiffness. Pretty soon we have six or seven setup variables all needing to be considered, and possibly millions of discrete setup permutations.
Canopy has two neat ways to resolve this problem. Firstly, we use constraints to reduce the dimensionality of the problem. We can automatically set the ride height and flap angles so that we have the right aerodynamic balance, and we don’t wear out our plank, before every single sim.
Next, we can run a Monte-Carlo simulation – a form of statistical sampling which allows us to build a picture of the entire setup space using only a fraction of the simulations that would other be required. Some clever mathematics then allows us to make predictions about points we never even simulated.
Here, we report both lap time and vMax: strategy teams will often favour vMax over ultimate lap time to some extent because overtaking is done on the straights, so having a faster car in a straight line is often strategically beneficial.
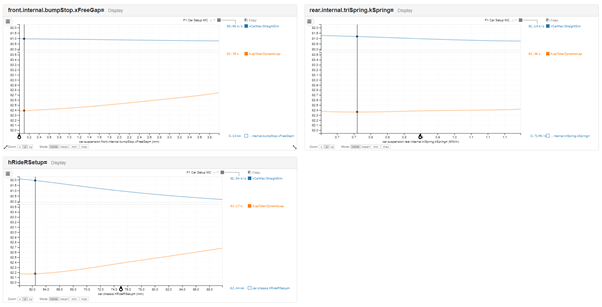
This plot shows the cross-sectional sensitivities of each setup dimension to lap time. The implication is clearly that the car should be low and stiff for this particular aerodynamic package.
Viewing all of the results at once risks a bit of information overload, but here goes. In the plot below, we show the full set of results from a Monte-Carlo simulation. There are a few things to note here. Firstly, the line in red: this is a prediction, looked up from a response surface generated by fitting over the simulation results that did solve. We have been able to find a result “off the chart” (purple circle) just by moving around the sliders on the left-hand axes.
Secondly, note that there are simulations which could go faster in a straight line, but that’s not optimal for lap time. This may come to the attention of your strategy team.
Thirdly, the axis on the right shows the setup ride height that was determined by the solver: we didn’t need to sweep this dimension, it was calculated for you, reducing the number of dimensions we needed to sweep.
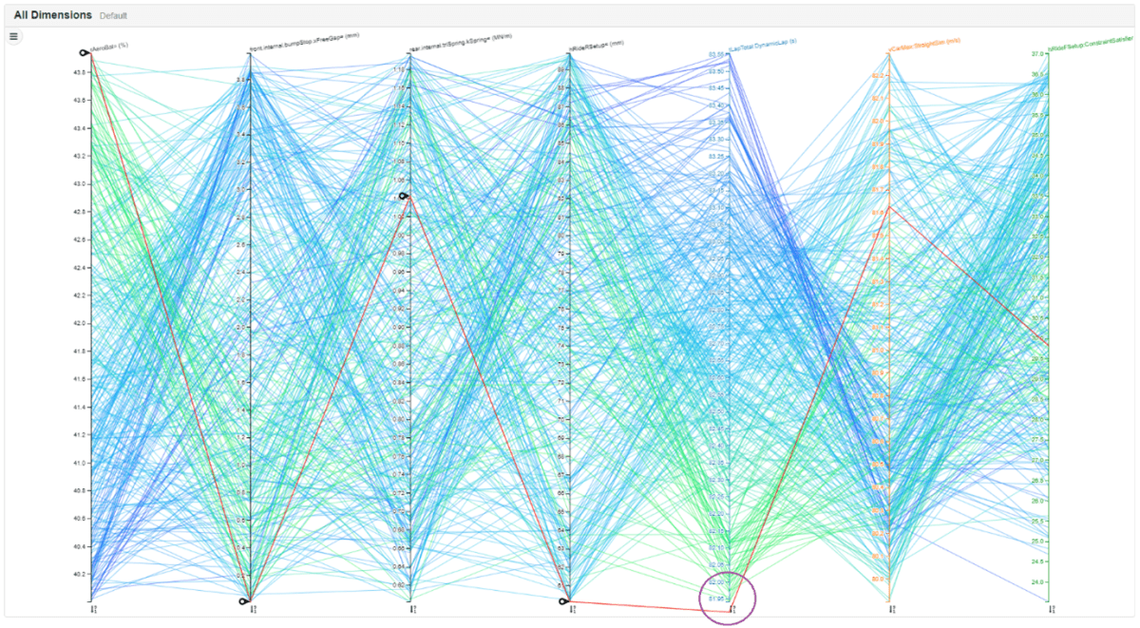
The full set of results from a Monte-Carlo simulation, displayed on a parallel coordinates plot. Every line represents a simulation, coloured by lap time. The green lines are fastest. The line in red is a prediction.
Encoded within this information are the details of pinning the front ride height as low as it’ll go, and setting up the rest of the car to shape the balance. But these are deserving of a topic on their own, and will be covered in some of the other articles in the series. For now, we move on to one of the things that sets F1 apart – the fact that teams can design their own cars.
Part 2: Shape the Balance through the Corner
In a lot of racing series, there isn’t much you can do to the car once the ride heights, springs, and dampers are fixed. But at the heart of F1 is an enormous additional “degree of freedom”: the freedom to design the aerodynamic surfaces almost any way you like. Simulation helps teams understand how to utilise this extra freedom.
The process of designing a Formula 1 car starts anything from eight months to three years ahead of the launch, depending on exactly how much the rules are changing, how much budget the team has, and how politically influenced the rules changes are…
The early stages of the development of an F1 car are the times for the richest gains on the curve of diminishing returns. This is the point where developing in the right direction, intelligently, and efficiently, brings huge gains far down the road. One of the most critical numbers in the organisation is the “development L/D ratio” or “isochronal ratio”.
Adding downforce to a racing car almost always comes with an increase in drag as well. The development L/D ratio is the amount of downforce that needs to be added to the car to cancel out the lap time loss associated with a unit of drag. This number is coded into every wind tunnel run: if the part being tested comes out ahead of the ratio, it goes on the car. If not, it goes in the bin.
Canopy needs just one simulation to work out what this number should be, thanks to a bit of clever maths we call “SLS”. The number varies a bit depending on the track, tyre characteristics, and downforce level, but surprisingly little else. For this reason, the plots shown below are on a deliberately unrepresentative car.
Running an SLS simulation gives lap time sensitivities in the region of -0.02 s/pt downforce, and +0.04 s/pt drag, yielding an L/D of -2.0. If a wind tunnel update can add more than 2.0 points of downforce for every point of drag, it goes on the car, no matter how big or small the actual downforce gain is.
It’s worth noting that this is a very low figure – high speed circuits like Monza can have values of -6 or -7.
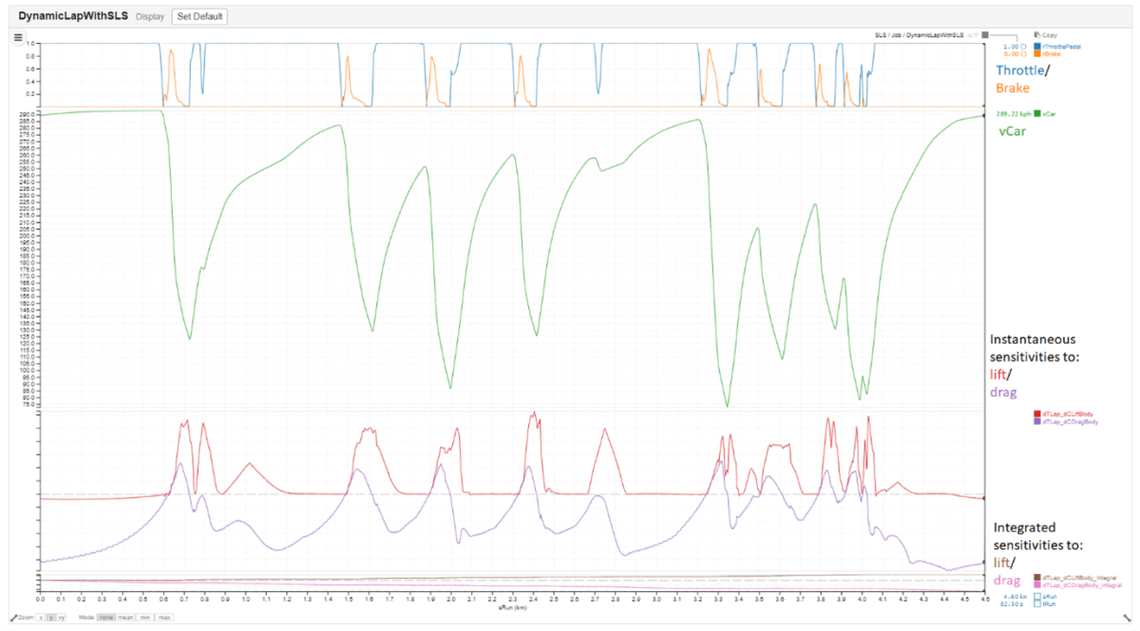
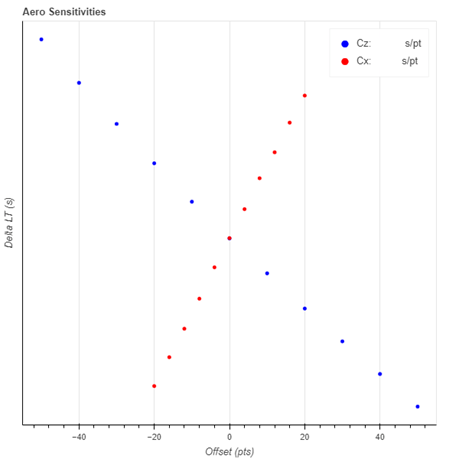
The lower traces here show the lap time sensitivities to drag and downforce at each individual point on track. As expected, lift sensitivity is almost zero in a straight line, and drag is beneficial in the braking zones. Axes and tooltips are intentionally blank.
That’s not all though, because in F1 the devil is in the detail. It doesn’t just matter what the headline downforce and drag numbers are – it matters where they happen. Downforce is mostly useless when the car is at 300 kph, and drag is helpful in the braking zones.
Clearly, it makes sense to focus your downforce-adding efforts in conditions where the car is grip-limited, and drag-removing efforts in conditions where the car is power-limited. Once again, SLS comes to the rescue. We can work out the sensitivity to lap time of a unit of downforce and drag at every point around the lap, and plot this in a scatter diagram against front and rear ride heights.
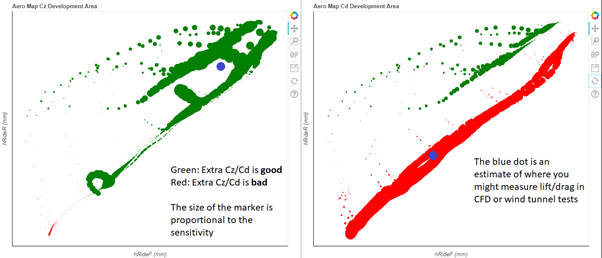
Where should you focus your development? An eyeballed estimate suggests that development should probably occur around the blue dots, but some clever maths could pin down the exact location. Axes once again intentionally blank.
So now we know – downforce is important at high ride heights, and drag is important throughout the range. That can be given to your aero department before they even start up a CAD program or so much as look at a wind tunnel, allowing them to shape the whole concept of the car from the ground up with full knowledge that the result will be in the right ballpark.
Part 3: Making the Tyres Not Explode
*Your mileage may vary.
Any time that the current F1 “formula” is not about aerodynamics, that’s because the tyres have decided to make themselves more important. At times, the sport turns into professional tyre management. The past two seasons have seen numerous tyre failures, in Imola, Baku, Silverstone, Mugello, and Qatar to name a few. By a measurable and significant margin, the tyres are the least reliable part of a Formula 1 car.
A common theme in all of these incidents has been that the tyres are old – usually following a long and demanding race stint on the corner of the car that takes the most load. It’s a not-unreasonable estimation that those tyres have accumulated the most “wear”.
Canopy can model the tyre wear that accumulates on a tyre and allows you to set a maximum limit per lap or per stint. Just like having a battery “energy budget”, Canopy can allocate the tyre energy optimally around the lap – telling you which corners to push and which corners to back off.
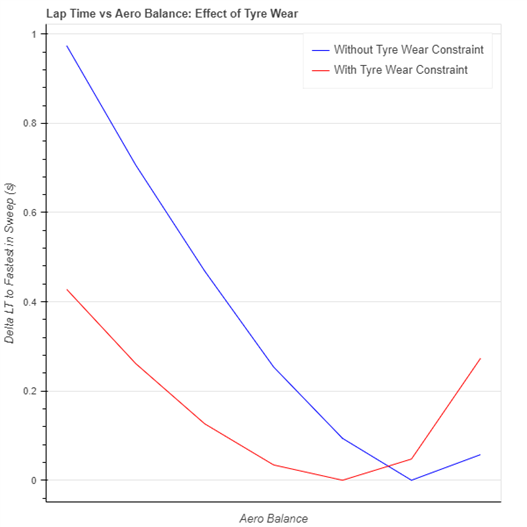
Adding a tyre wear constraint to the solver leads to it favouring more rearwards aerodynamic balance (less load on the front tyres), and losing more time with forwards balances.
If the setup sweeps are done with this feature in mind, all of the car’s setups, sensitivities, and even the L/D ratio, will be chosen so that limiting tyre sliding energy is a key feature not just of the car setup, but also of the car design.
It is also possible to model the temperature evolution of a tyre. Drivers will often talk about driving carefully in the first sector of a lap so that they can push hard for the final sector: this is about keeping the tyre temperatures under control. Once again, it comes down to optimal resource management around the lap – something that Canopy does very naturally.
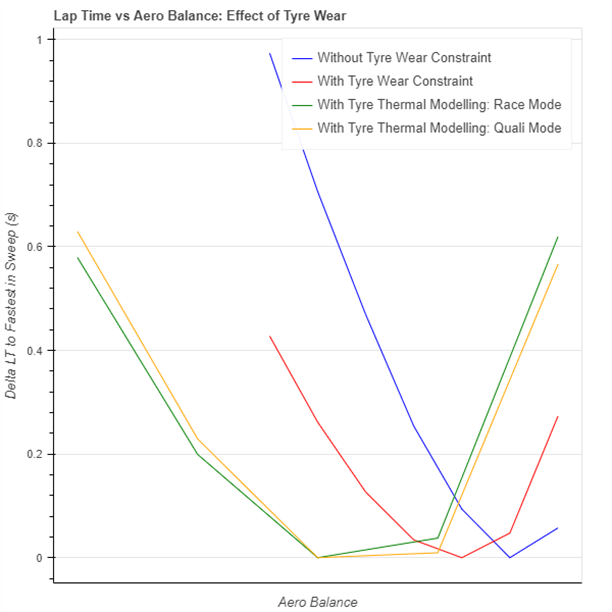
With the thermal evolution modelled, the car’s balance is forced even further rearwards. Canopy can demonstrate how a qualifying lap should be driven differently to a race lap, and how the optimum aerodynamic balance for the car changes between qualifying and the race. When there’s no requirement to drive multiple sequential fast laps on the same set of tyres, the rear tyres can be abused no end, so there’s less penalty for having a forward aerodynamic balance. In the race, however, the balance needs to be wound back, because those rear tyres need to stay under control for the whole stint.
When the full tyre thermal model is used, the aerodynamic balance is even further constrained to be rearwards. In qualifying, however, a little extra front flap can help.
The Future of F1
As Formula 1 tries to find its place in a modern world, where cost constraints restrict development and sporting constraints restrict testing, the importance of simulation tools is increasing rapidly.
At its heart, Formula 1 is still the pinnacle of motorsport, pitting the fastest cars and drivers against each other on closed circuits in the ultimate test of lap time. The car design remains an aerodynamic challenge – get the most downforce onto the car for the least drag possible, and the car setup and driving remains a tyre management exercise.
The new rules for 2022 aren’t going to change any of that, but they will change the way that both of those goals are achieved in a big way – and it is simulations that have provided the answers to the important questions before a wheel is turned.
If you enjoyed reading this, you might like Dr Oliver Watkins’ piece on the Soul of Formula E.