Enhancing the Art of Race Car Setup: The Ultimate Balance
November 27, 2024
by Rowland Jowett
The best racing drivers know how to manage car performance and strategy throughout the race, but the engineering team can provide the driver with a fundamentally faster car. When it comes to picking downforce level for a particular circuit it used to be a simple case of running a laptime simulation at each level and finding the fastest. With the introduction of advanced fully dynamic simulation it is possible to model far more realistic physical interactions and avoid surprise encounters such as a car that is fast in qualifying but destroys tyres in the race.
The Downforce Dilemma
Adding downforce makes your car stick to the track better, allowing faster cornering. However, with downforce comes drag that slows the car on the straights. The trick is to find the sweet spot for each circuit. This balance is crucial because every track has its unique mix of long straights and tight corners.
The Isochronal Ratio
Imagine a magical ratio where changes in lift and drag do not affect lap time at a particular circuit. This is the isochronal ratio. Occasionally it happens that the range of car downforce options coincide with this ratio. One setup is faster in corners but slower on straights, while another has the opposite characteristics, but both yield the same laptime as shown in the chart below. Which setup is best?
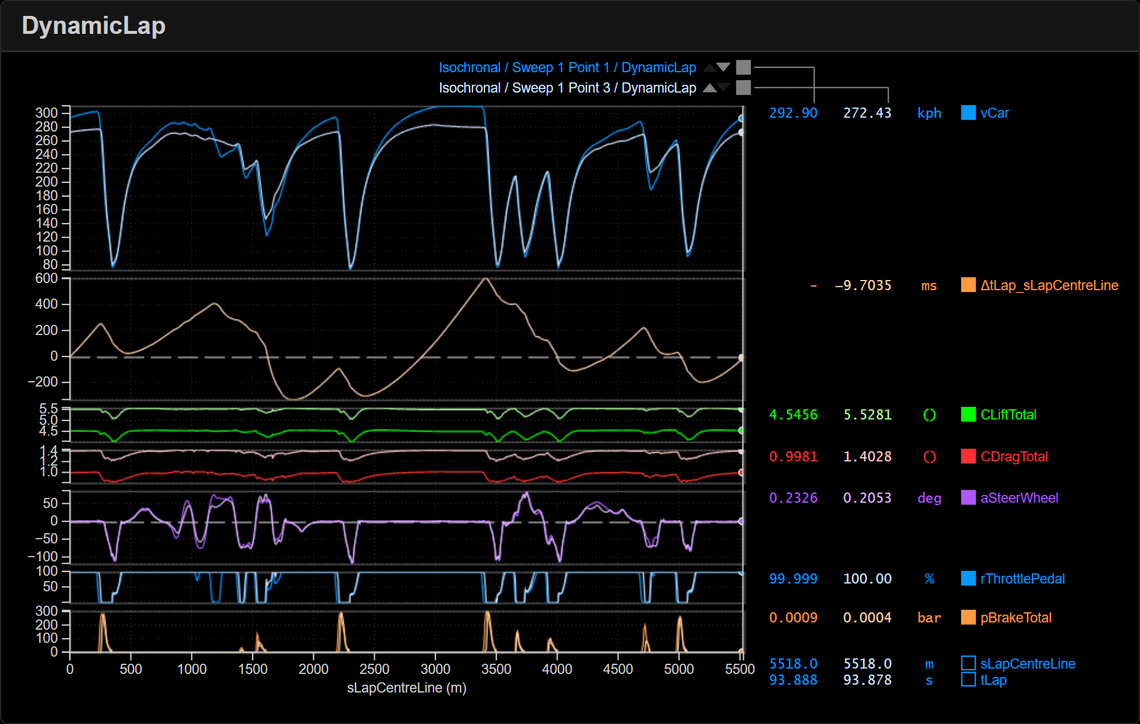
From this Canopy/Michelin laptime simulation the high downforce setup (car speed shown in light blue) is about 20kph slower on straights but gains time in medium and high-speed corners. The low downforce setup (dark blue) is faster on straights but slower in corners. Despite these differences, the total lap time remains equal, making the choice between them dependent on other factors like tyre wear, fuel consumption, and race strategy.
Beyond Qualifying Time
In a race, tyre and brake temperatures, fuel consumption, and overtaking potential are crucial. Different downforce levels impact these factors, so picking the right setup is key. High downforce can help preserve tyres, but it also increases fuel consumption due to higher drag. Conversely, low downforce might save fuel but can lead to higher tyre wear and brake temperatures. Teams must consider these trade-offs to ensure optimal performance throughout the race.
Parallel Coordinates Chart
Visualising trade-offs between more than three dimensions can be challenging. One tool available is the parallel coordinates chart:
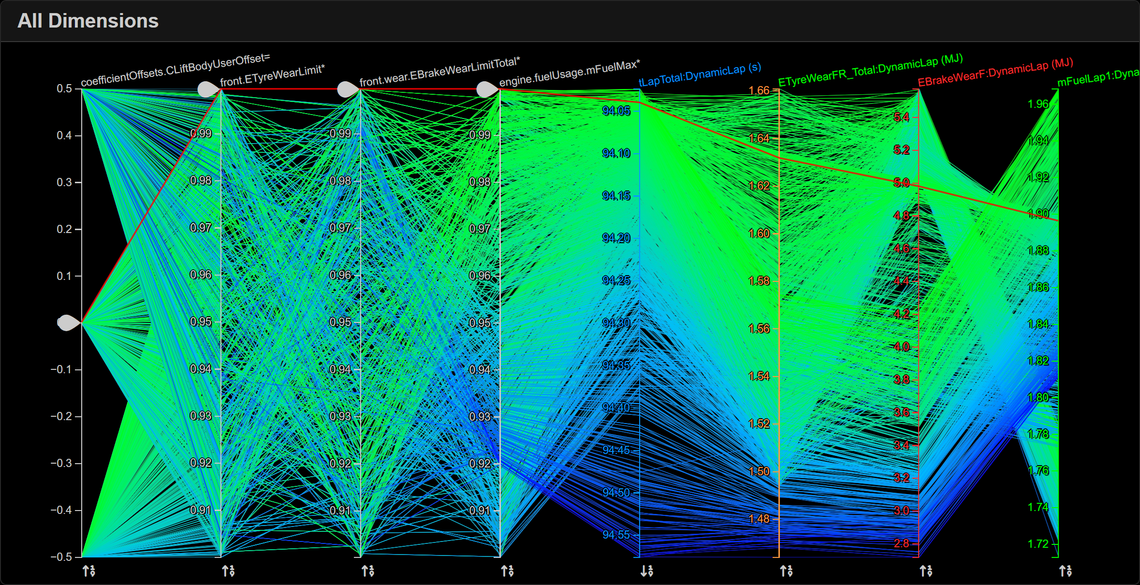
This type of chart allows engineers to plot multiple variables on parallel axes, making it easier to see how changes in one aspect affect others. For instance, increasing downforce might improve cornering speed but also raise fuel consumption. By adjusting the sliders on the chart, engineers can identify the best compromise.
On the left-hand side are the simulation inputs, while the right-hand side contains the outputs. Each blue/green line represents a single Dynamic Lap simulation around Austin, coloured by laptime. The red line is an interpolation on the n-dimensional results surface which moves according to the position of the input sliders.
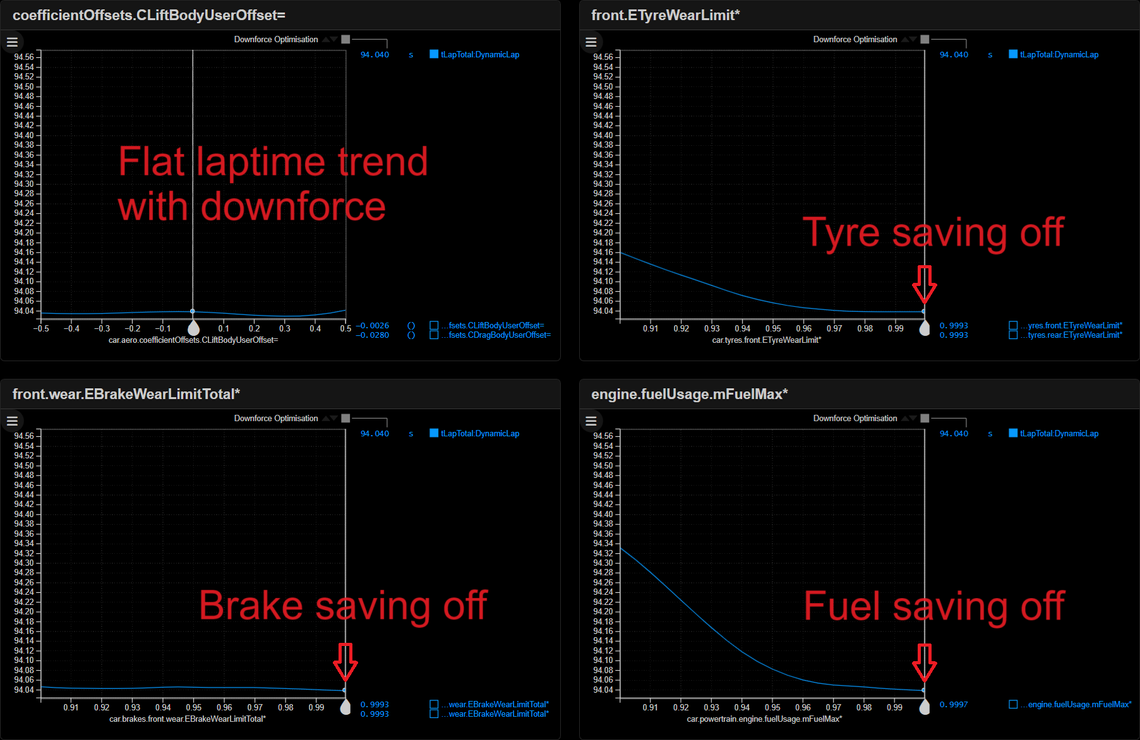
Setting the sliders to zero tyre/brake/fuel saving, shows the trend of laptime with downforce is flat. For a single lap with tyres at optimal temperature it does not matter which downforce level we pick as illustrated below.
Tyre Management
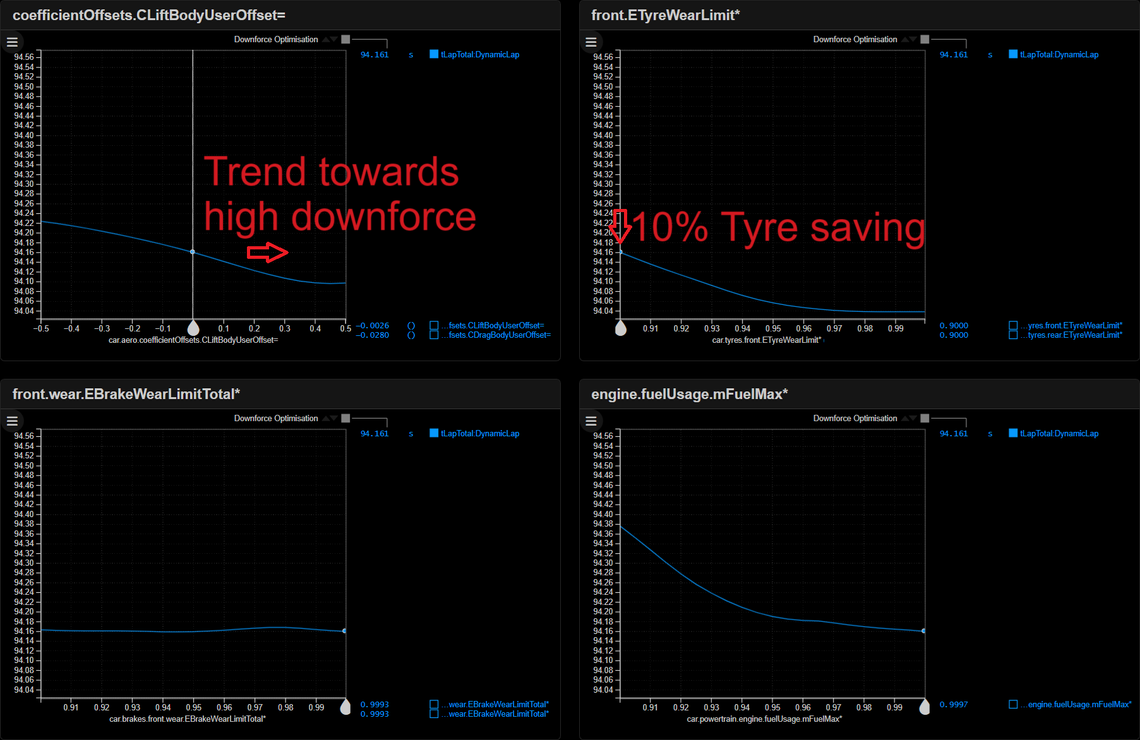
If the tyre energy slider is moved to 90% (10% tyre saving), laptime is worsened from 94.04sec to 94.16sec (+0.12sec). However, the gradient of laptime with downforce is no longer flat and favours higher downforce. By adding downforce, half of this laptime loss is clawed back (-0.06sec). This results in a car setup that is fundamentally more sympathetic to the tyres. The driver can now concentrate their efforts on driving fast rather than nursing the tyres.
Where downforce helps the tyres
By plotting the total tyre sliding power on the track viewer, we can see the most damaging areas. At Austin, the car enters the high-speed Esses after the first corner with higher speed due to low downforce and drag. However, it scrubs speed through tyre slip, causing damaging peaks in sliding power.

Fuel Efficiency
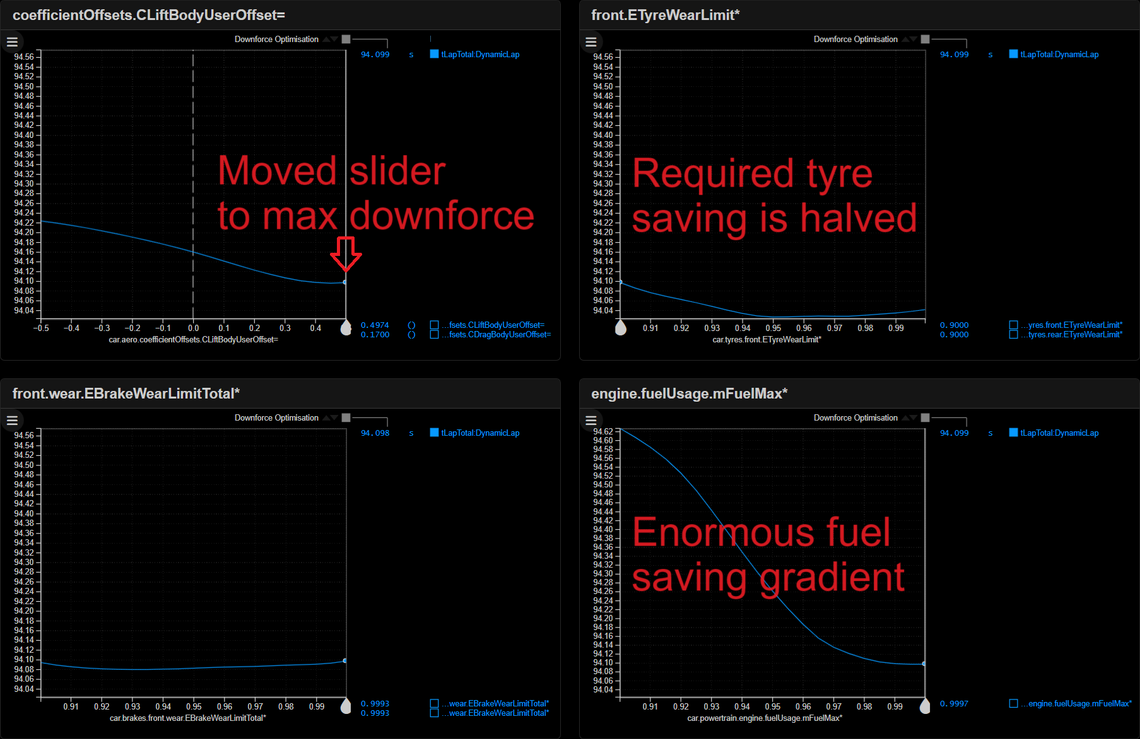
High downforce setups use more fuel due to increased drag and more time spent at full throttle on the straights. Our requirement to save the tyres is at odds with fuel consumption.
The Perfect Setup
Finding the right setup is about balancing all these factors. Small adjustments can make a significant difference, but the trades are non-linear so going too far in one direction can hurt performance. For instance, focusing too much on tyre preservation might lead to higher fuel consumption, while prioritising fuel efficiency could increase tyre and brake wear. The key is to find a setup that offers the best overall performance, without compromising heavily on any single aspect.
Conclusion
A well-balanced car setup lets drivers focus on flat out racing. By understanding and managing how downforce or car setup in general interacts with tyre, brake, and fuel saving, teams can gain a competitive edge. This is why performance advantage can swing from one team to another from race to race as teams struggle to adapt to the varying demands of each circuit. The relative attributes of each car depend not only on the contributions from the powertrain, chassis, tyres, and aero departments but on how well these elements are balanced. Effective car setups result from meticulous planning and simulation removing the burden from the driver and making the racing closer than ever before.
In the end, it is these choices that make motorsport so fascinating. Whether it is finding the perfect downforce level, managing tyre wear, or optimising fuel consumption, every decision counts. It is this relentless pursuit of perfection that keeps fans on the edge of their seats, and what drives us in the pursuit of ever more realistic simulation technology.