GT Cars and BoP: Finding The Balance
November 11, 2026
by Dr Ben Snowball
A GT race is a lot to manage, to put it mildly. Over multiple hours, your car will be driven by different drivers, navigate traffic from different classes, survive the inevitable safety car or Full Course Yellow, and consume a small mountain of tyres.
Beneath all that chaos, though, there is a more fundamental constraint.
In most forms of motorsport, the car is yours to develop, and you are free to find performance. GT racing is different. Balance of Performance (BoP) exists to level the field, with the series organisers the ones holding the bar at the chosen level, as it were. Weight might be added, power might get trimmed, etc. It almost sounds like a lot of control has been taken out of the race engineers’ hands.
However, a question that naturally comes to mind is: “Of all the parameters the BoP affects, which ones matter the most for my car, at this track, on this weekend?”
Fortunately or unfortunately, depending on the sort of person you are, the answer is not always obvious. A weight penalty of X kg and a power reduction of Y kW might look equivalent on the surface, when in reality they are not. On a high-speed or heavy-braking track, these will have wildly different effects. Maybe that is obvious, but what is not obvious is how different they are. Cue simulation.
The BoP Problem
Each major GT series (WEC, IMSA, SRO’s GT World Challenge) publishes its own BoP tables, updated at intervals throughout the season. The same car may carry a different weight, run a different restrictor, or be permitted a different rear wing angle depending on whether it is racing at Spa in April or Laguna Seca in August. You get the idea.
The parameters typically affected are:
Minimum weight: effectively a direct laptime penalty through inertia, tyre load, etc.
Power limits: limitations on peak and mid-range engine output.
Aerodynamic trim: constraints on front and rear wing settings.
Each of these clearly hurts laptime. But some will be more damaging than others. Wouldn’t it be nice to find out not just how much, but where on track, these each affect the car’s lap?
Sensitivity Sweeps as a BoP Tool
This is where Dynamic Lap earns its gold star for a GT engineer. We can treat the BoP parameters as the subject of a simulation.
A “sensitivity sweep” can be run across each parameter, and the laptime can tell you which matters most at the circuit you are about to visit. How wonderful!
We can see this in a sensitivity plot over a factorial “Exploration” using Canopy.
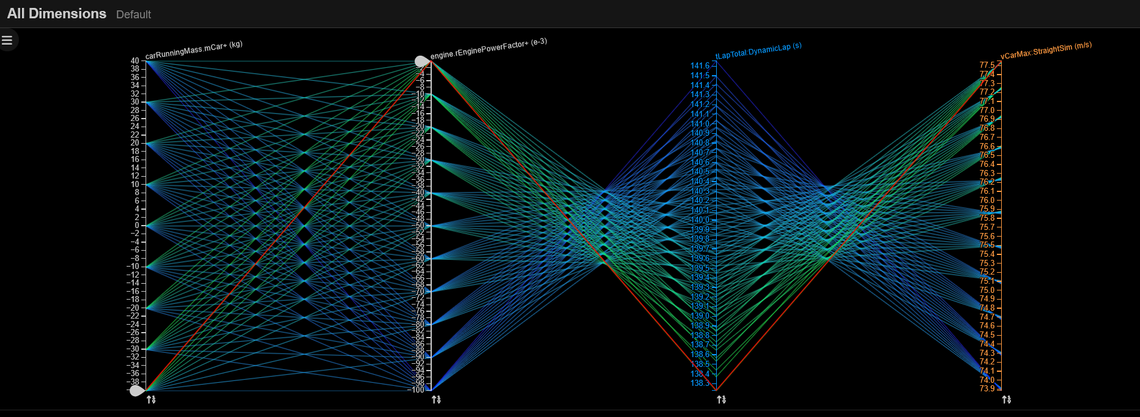
All sim results for an exploration over the ranges of weight offsets and power factor penalties.
Our default GT3 car has been simulated using Dynamic Lap around Spa, over a range of weight (axis 1) and power factor (axis 2) penalties. The plot explicitly tells us how these parameters interact to affect laptime (axis 3).
We can pick a couple of these sims, and inspect the deltas for laptime and vCar for each against the baseline.
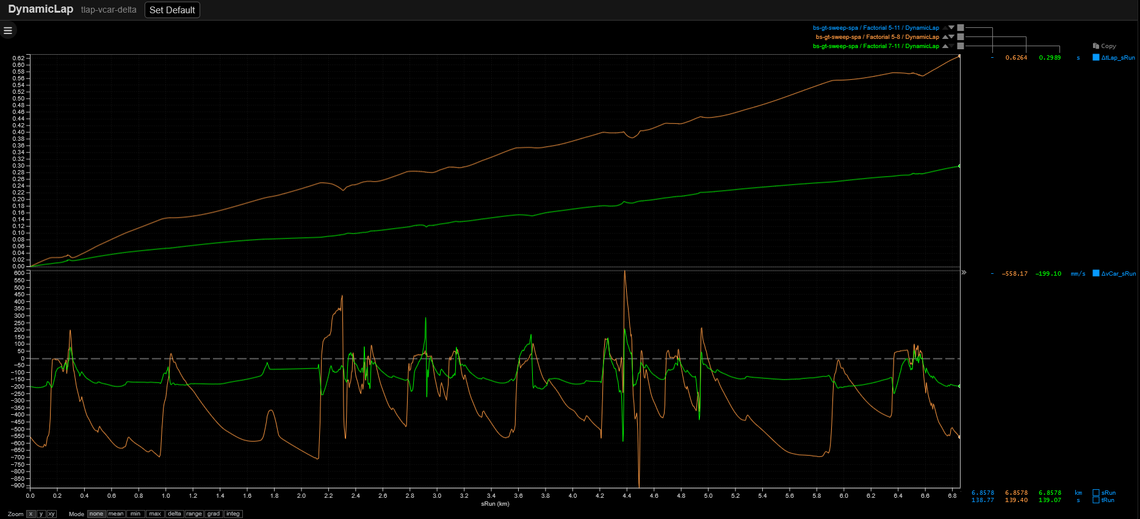
Lap time and speed deltas for mass and power penalties at Spa.
Applying just a mass penalty of 20 kg (orange delta) is significantly better than taking a power hit of roughly 15 kW (green delta) over the lap around Spa.
On the whole, results tend to look something like this:
At a power-limited circuit (long straights, modest downforce), power sensitivity dominates. A 10 kW reduction costs significantly more than a 10 kg weight addition.
At a mechanical grip circuit (technical, slow speed), the weight penalty becomes the dominant factor.
At a high-downforce circuit, aero trim restrictions can be surprisingly damaging. And not just through drag, but through a reduction in corner entry stability and cornering speed.
As an example, we can compare the same GT car around Monza and the Singapore street circuit, specifically exploring how the same range of aerodynamic lift offsets and power factor offsets affect laptimes.
The car around the power-limited Monza is more harshly punished by the power penalties. The extremes of the sweep emphasise this, where we have zoomed in on deltas for the harshest lift penalty (green) and harshest power penalty (orange) simulations.
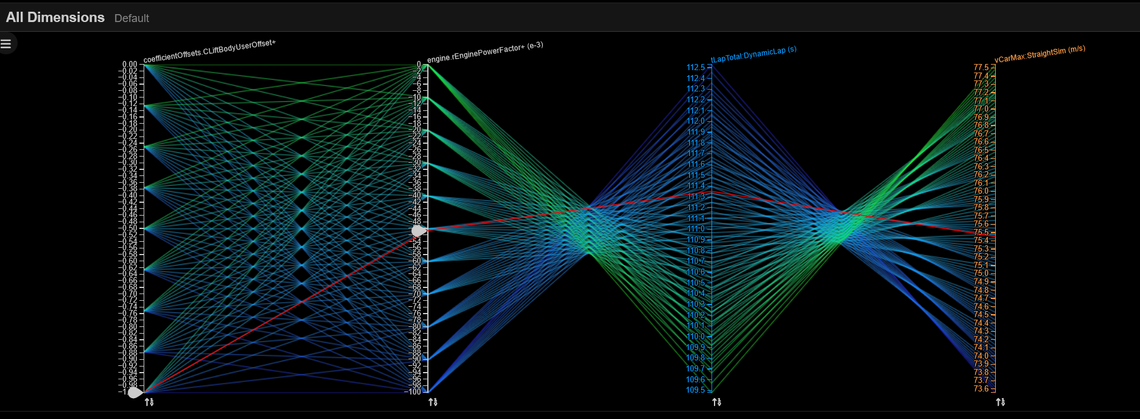
Lift offset and power factor sweeps at Monza.
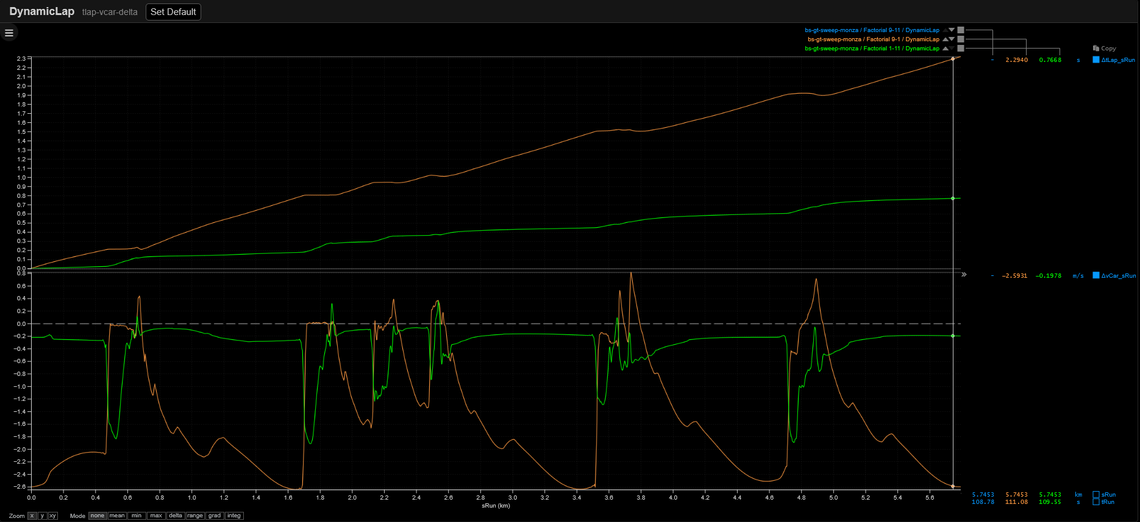
Lap time and speed deltas for lift and power penalties at Monza.
Meanwhile, the tricky, technical, downforce-focused Singapore track is more forgiving of the power penalties but equivalent aero offsets affect laptime more severely than at Monza. The selected baseline deltas being much closer together demonstrate this further.
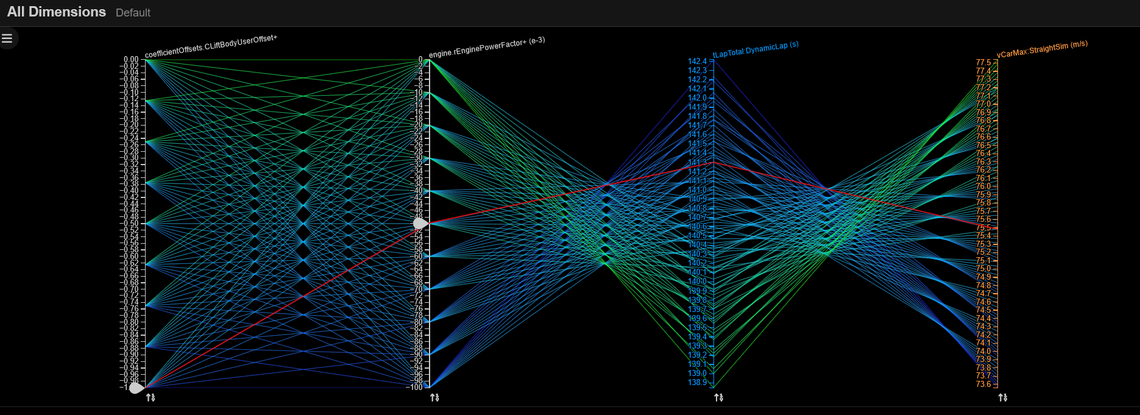
Lift offset and power factor sweeps at Singapore.
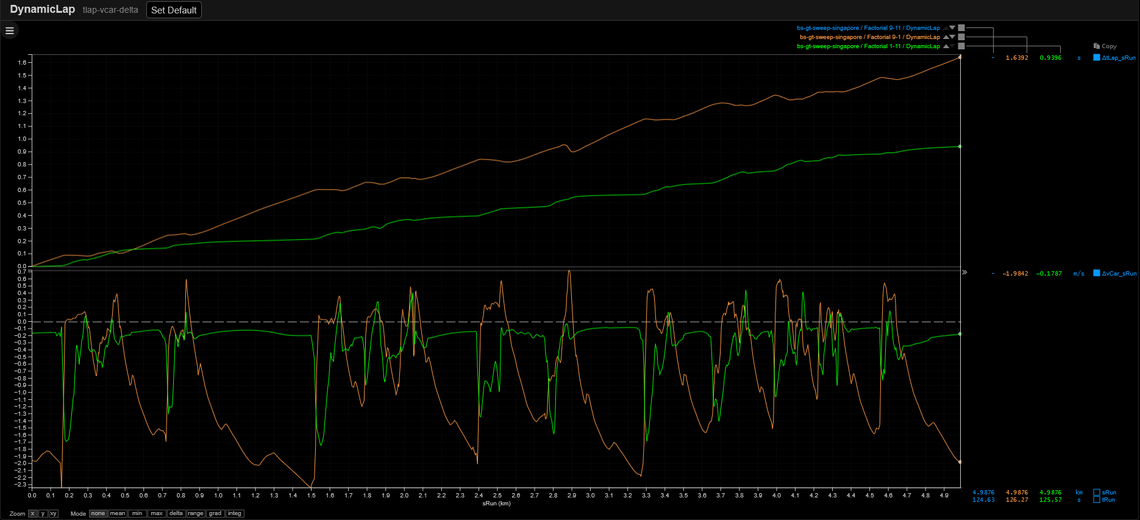
Lap time and speed deltas for lift and power penalties at Singapore.
None of this is that revolutionary. But it is extremely valuable to have concrete numbers for laptime deltas per unit of BoP change, and even to be able to see exactly where on track time is lost.
A “Dynamic Lap SLS” simulation will provide sensitivities for small changes in various parameters (mass, aero balance, grip, etc.), and, crucially, where these alterations cost lap time, as each sensitivity is local to each point on track. Although this isn’t at the level of a BoP effect, it will identify for an engineer where a penalty might hit hardest. The plot below demonstrates just this for the GT3 car around Spa again. Peaks effectively show where the car is most sensitive to small changes in this parameter, which is a useful indicator of where a penalty will hurt most.
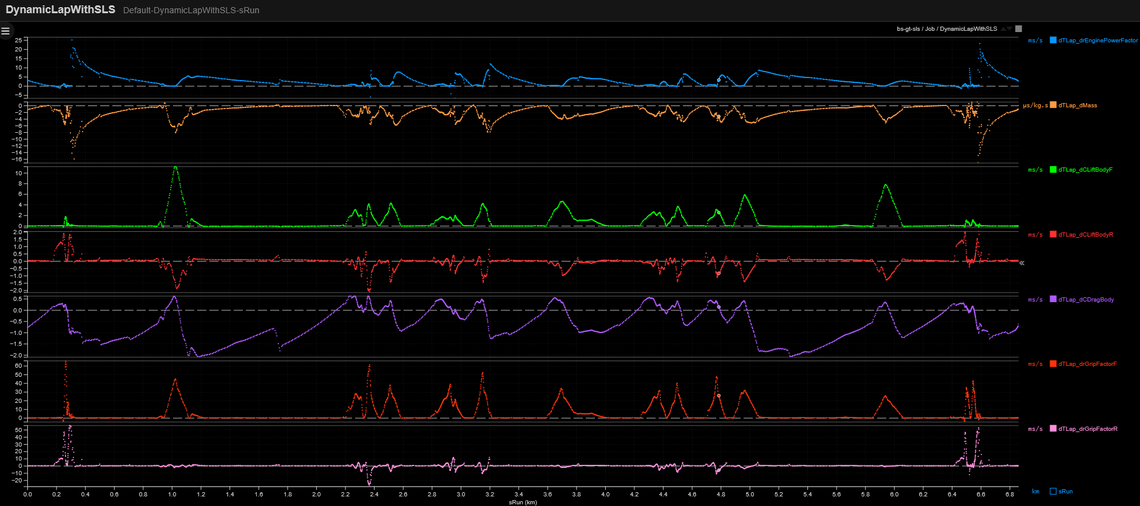
Local lap time sensitivities around Spa.
All GT Cars Are Equal, But Some Are More Equal Than Others
Every GT3 car, for example, will have a different engine architecture, different aerodynamic characteristics, and a different mass distribution. Hence the same BoP adjustment will not affect all competitors equally. For instance, a front-engined car will respond differently to a weight distribution constraint than a mid-engined car.
Canopy users can set their GT car configurations to capture these differences at the level of engine torque maps, suspension geometry, and aerodynamic response. For a sensitivity sweep, you can gain crucial information about your car, on this circuit, under this BoP. Not just what any old GT car is doing. Lovely stuff!
A Practical Workflow Using Canopy
For the uninitiated, the process ahead of each event is straightforward:
Update your BoP parameters in your car configuration to reflect the current series table.
Run sweeps (looking at weight, power, aero drag, downforce, etc.) across a realistic range (for example ±20kg, ±15kW, ±5% aero efficiency).
See the plots and data of your laptime against each parameter, which will tell you your sensitivity to each.
You can extend this and compare across circuits to build up a circuit-by-circuit sensitivity map over the rest of the season. A picture will emerge of where your car is structurally disadvantaged by the BoP, and where it is relatively protected.
Final Thoughts
BoP is fundamental to what makes the GT class commercially viable and exciting for manufacturers. But that does not mean one has to be passive about it! Simulation gives you the ability to understand precisely what the rulebook is costing you, and hence do something about it!
In a category where the margins are tight and the regulations are a big constraint, knowing your sensitivities is its own form of performance gain.
Interested in setting up BoP sensitivity studies for your GT programme? Contact our team at hello@canopysimulations.com.